
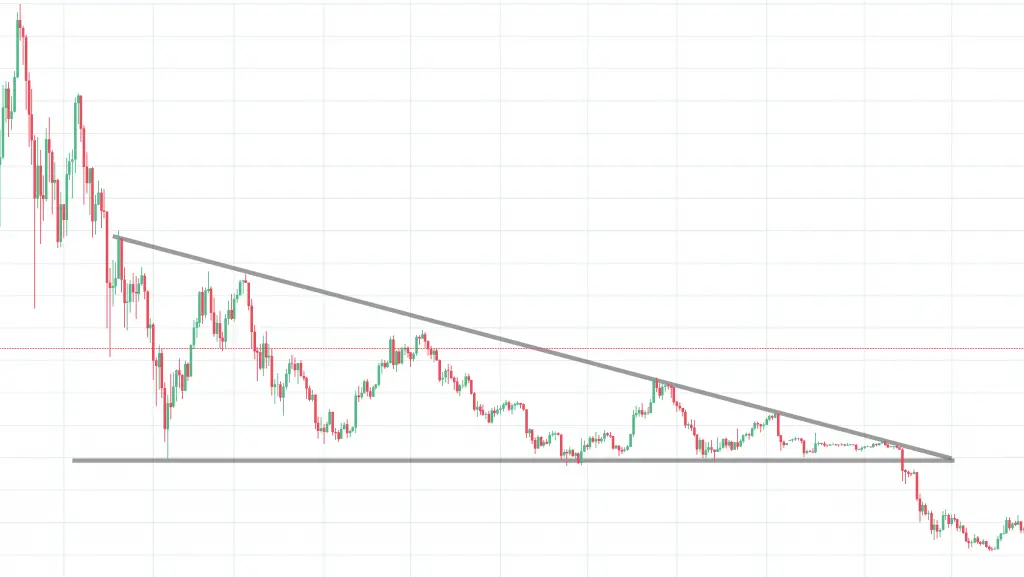
A descending triangle is a chart pattern created with a horizontal line and a falling trendine combined together to create a triangle. Basically, its look is opposite as that of the ascending triangle pattern.
Identification: A descending triangle is a pattern created by a horizontal line along the swing lows and a falling trendline along the swing highs.
Occurrence: This triangle occurs if the trendline runs along at least two swings highs and the horizontal line along two lows.
Study: A descending triangle clearly show that demand for an asset, derivative, or commodity is weakening. If the price breaks below the lower support, it indicates that downward momentum is likely to continue. However, upper breakout is also on paper in some cases. Traders usually tend to wait for the breakout before taking any call.