
A doji (dо̄ji) candle pattern signifies a candle developed in a trading session in which a security has virtually equal open and close levels. Based on this shape, technical analysts attempt to make assumptions about future price behaviour. Doji candlesticks can look like a cross, inverted cross, or plus sign.
Identification: In Japanese, “doji” (どうじ/ 同事) stands for “the same thing,” signifying an event when the open and close price for a security is exactly the same. Depending on where the open/close line falls, a doji is differentiated under three different titles i.e. a gravestone, long-legged, or dragonfly.
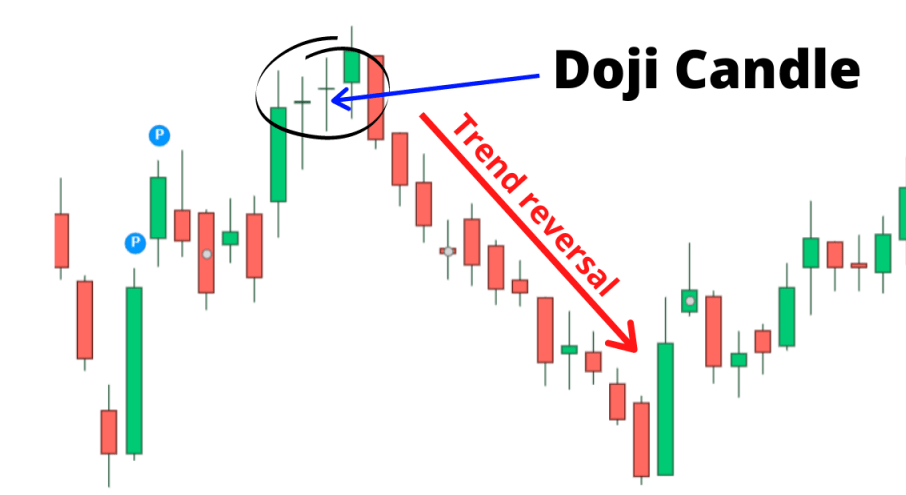
Occurrence: A doji occurs when the opening and closing levels are almost same. This occurrence also signals a trend reversal in some cases.
Study: A doji candlestick sometimes signals a trend reversal and an indecision about future prices. It can reveal information about market trends, sentiment, momentum, and volatility. A doji occurs as a signal of such market actions and reactions.